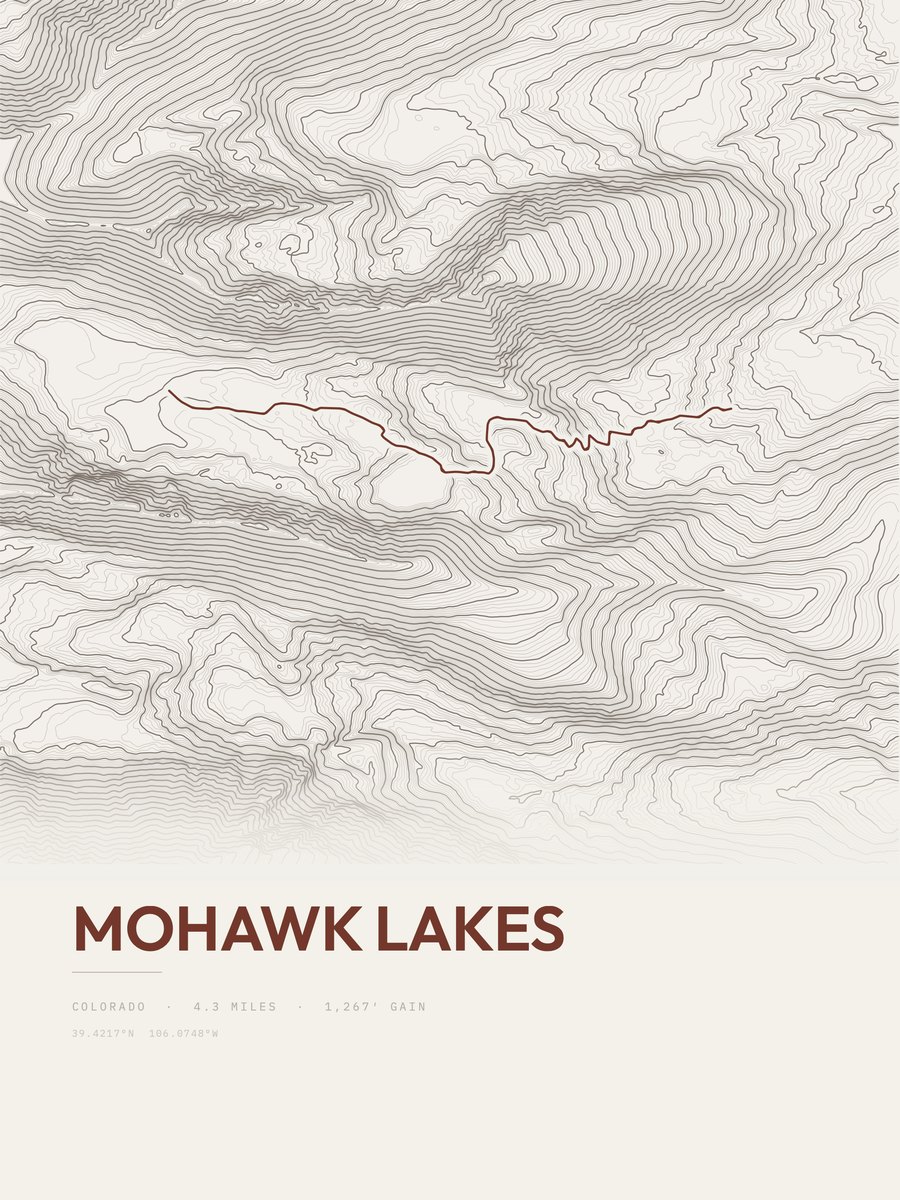










Mohawk Lakes
The print
Printed to order at 300 DPI, rendered natively at your size and never upscaled. Print only; the frame in the photos is for scale.
Shipping & returns
Printed in 2 to 5 business days, then 3 to 5 in transit within the US, rolled in a sturdy tube. Free US shipping; outside the US, shipping is calculated at checkout. 14-day reprint-or-refund guarantee, any reason, no return shipping. You have 1 hour after checkout to change trail, style or size, just reply to your confirmation email. Full returns policy.
About the Mohawk Lakes trail
Set in Central Rockies, Mohawk Lakes is an out-and-back of 4.3 miles. Expect 1,267 feet of climbing between 11,133 feet and 12,395 feet. The steepest pitch reaches 35 percent, against an average of 295 feet of gain per mile. On our gain-and-distance scale it falls in the moderately strenuous band. The nearest town is Vail, about 22 miles away.
Along the route
- Lower Falls Vistami 0.5
Places OpenStreetMap maps within 150 m of the route.
More trails in Central Rockies
Questions about the Mohawk Lakes print
What sizes does the Mohawk Lakes poster come in?
Is this made from real elevation data?
How hard is Mohawk Lakes?
Place names along the route: © OpenStreetMap contributors, ODbL. Best months are an estimate from NASA POWER climate data (CC BY 4.0), 2001 to 2020 monthly averages adjusted to the trail's elevation, not an official season; check current conditions and closures.