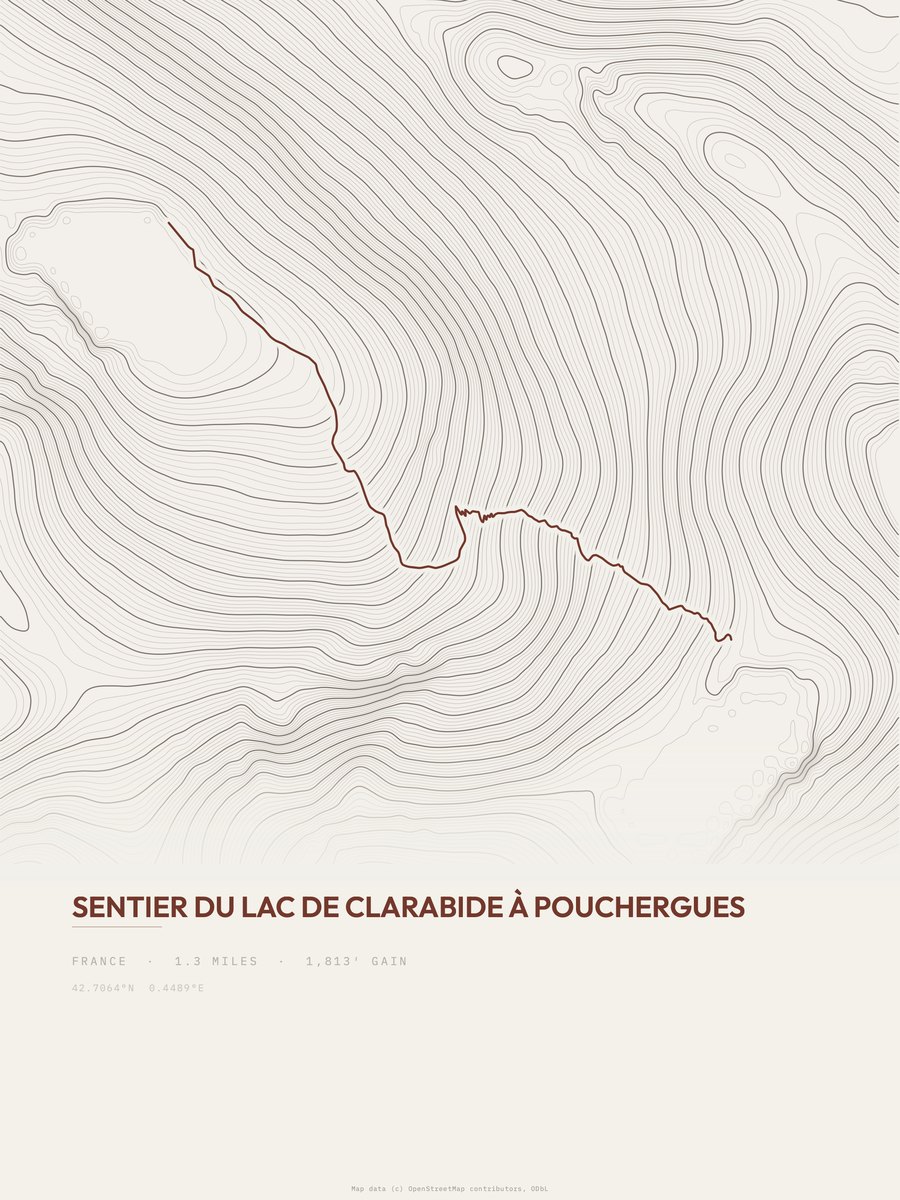







Lac de Clarabide à Pouchergues
The print
Printed to order at 300 DPI, rendered natively at your size and never upscaled. Print only; the frame in the photos is for scale.
Shipping & returns
Printed in 2 to 5 business days, then 3 to 5 in transit within the US, rolled in a sturdy tube. Free US shipping; outside the US, shipping is calculated at checkout. 14-day reprint-or-refund guarantee, any reason, no return shipping. You have 1 hour after checkout to change trail, style or size, just reply to your confirmation email. Full returns policy.
About the Lac de Clarabide à Pouchergues trail
The Lac de Clarabide à Pouchergues route in France measures 1.3 miles and gains 1,813 feet, with a low point of 6,931 feet and a high point of 8,707 feet. The steepest pitch reaches 49 percent, against an average of 1,395 feet of gain per mile. The 1.3 miles is the one-way distance of the drawn route. On our gain-and-distance scale it falls in the moderate band. The nearest town is Vielha, about 18 miles away.
Questions about the Lac de Clarabide à Pouchergues print
What sizes does the Lac de Clarabide à Pouchergues poster come in?
Is this made from real elevation data?
How hard is Lac de Clarabide à Pouchergues?
Trail geometry for this print: Map data © OpenStreetMap contributors, ODbL. Elevation: AWS Terrain Tiles. The derived trail dataset is published at /open-data. Best months are an estimate from NASA POWER climate data (CC BY 4.0), 2001 to 2020 monthly averages adjusted to the trail's elevation, not an official season; check current conditions and closures.